How does it work?
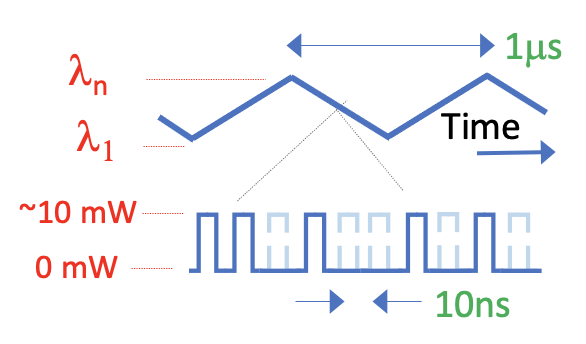
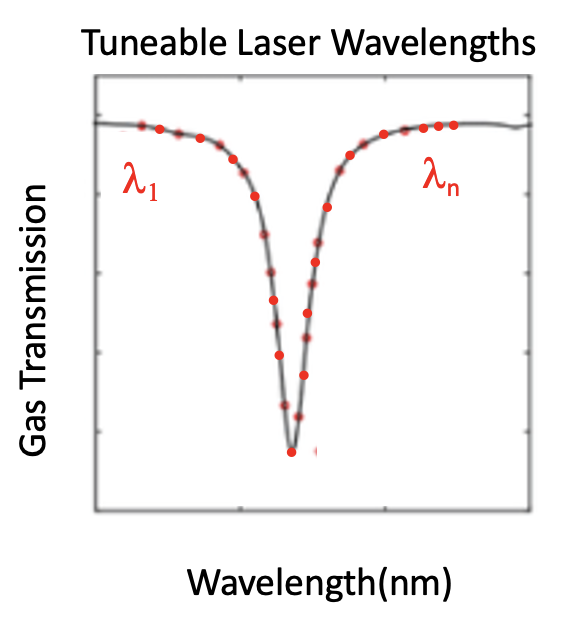
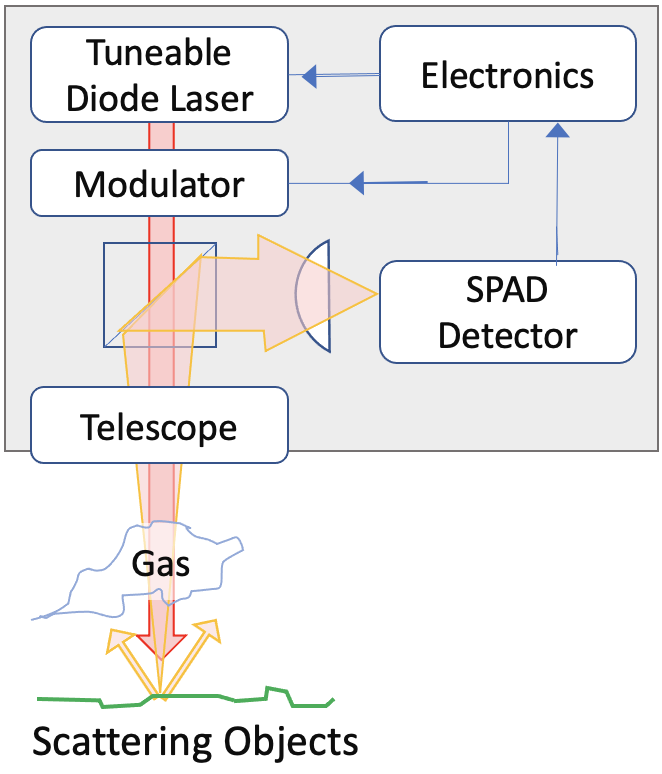
The lidar's laser is continuously tuned in wavelength over an absorption line of the gas
molecule of interest, in this
case methane in the near-infrared at 1651nm. The laser is simultaneously amplitude
modulated
with a random code and is
projected by the lidar transceiver out onto objects in the distance, passing through any
gas
plumes between the solid
object and the lidar. Light scattered off surfaces in the distance travels back into the
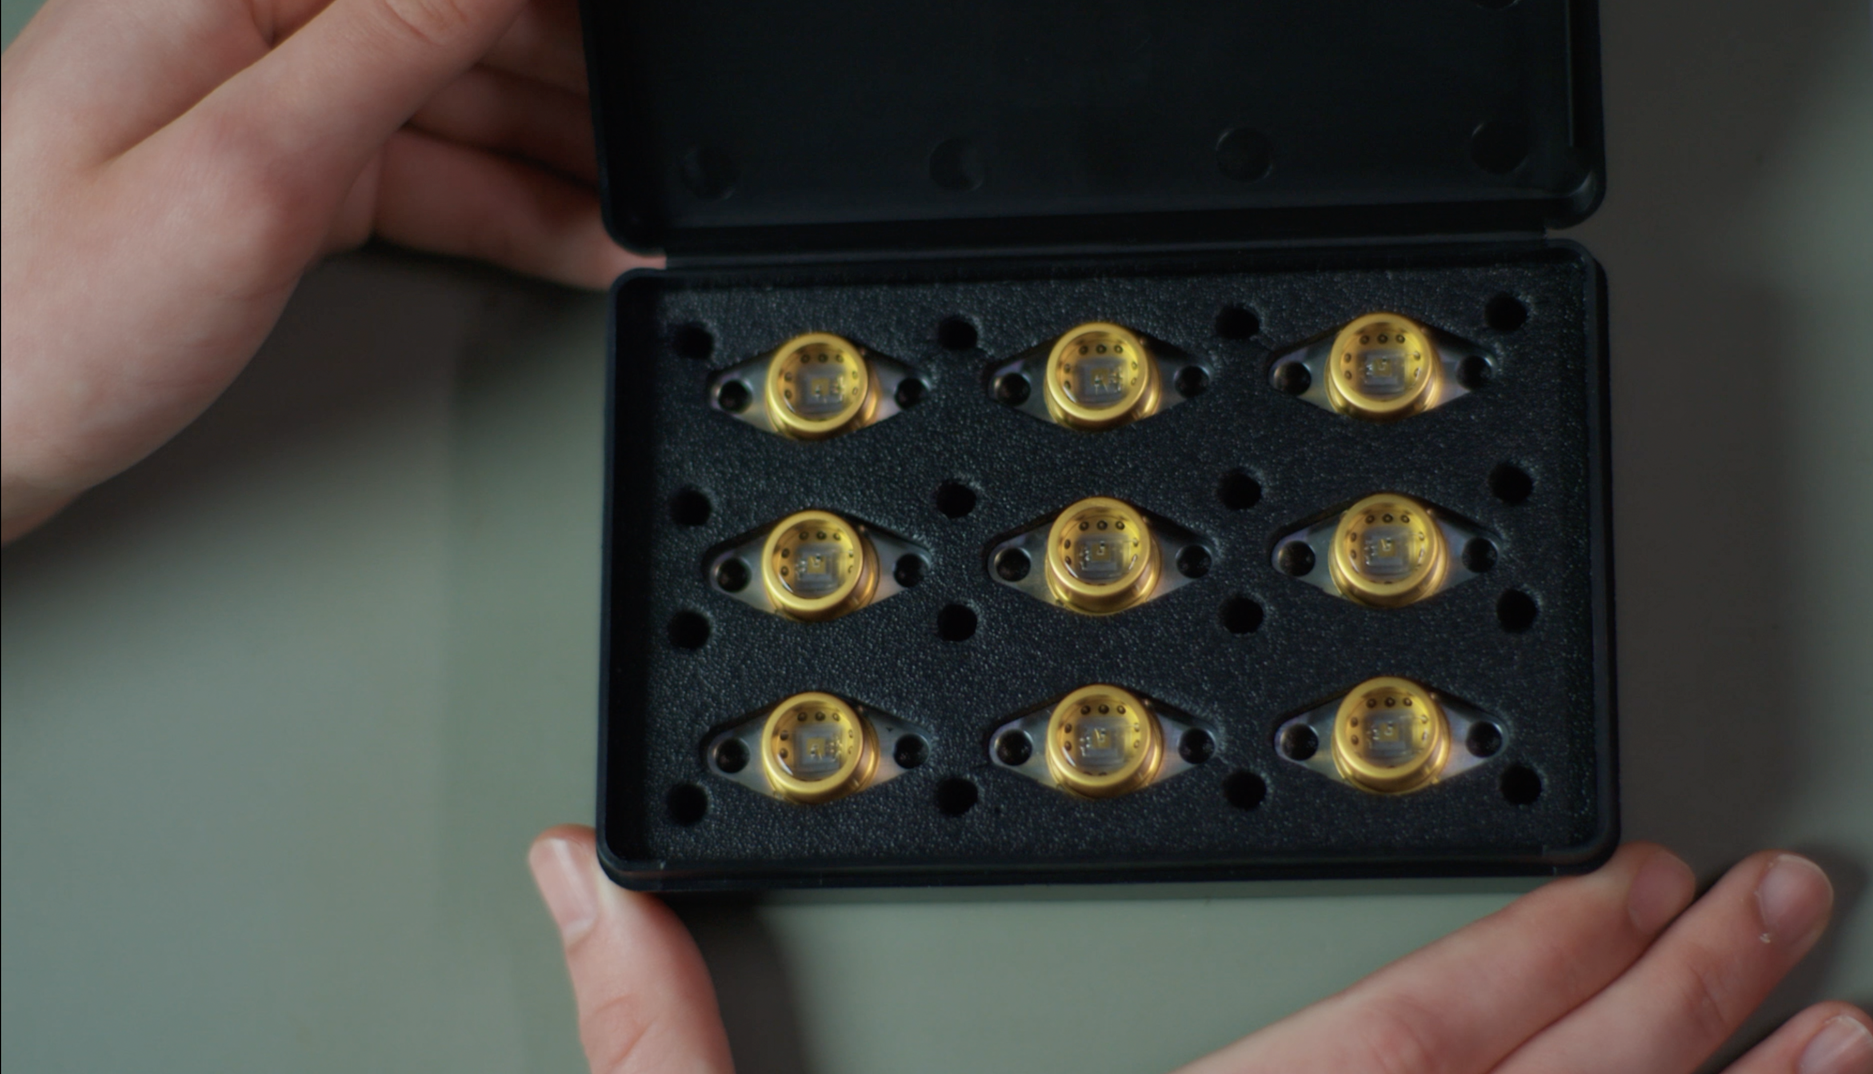
transceiver and is detected by
the SPAD.
The time-correlated lidar signal gives the distance to scattering surface and using
absorption spectroscopy enabled by
the laser tuning, the gas concentration pathlength (ppm*m) is measured along each
pointing
vector of the laser as the
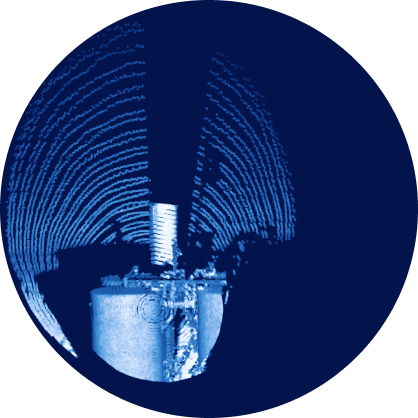
lidar scanner - a set of rotating Risley prisms - scans the beam across the lidar's
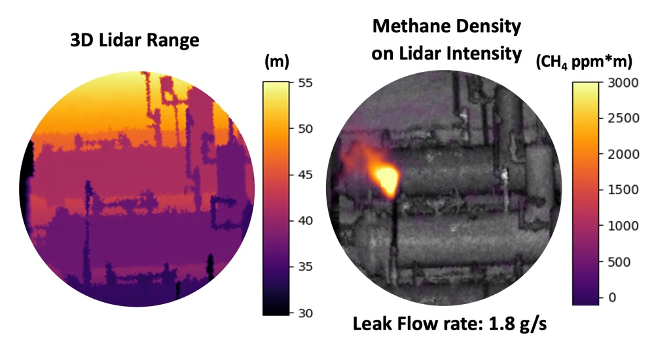
circular, two-dimensional field of view (FoV). This provides a lidar point cloud from
which lidar images (lidar
intensity
and range) and a gas density
image of any gas plume within the FoV can be produced.
Scanning the lidar's laser around a scene builds up a 3D picture (lidar point cloud) of
objects and gas showing the exact plume location, shape and size.
The total gas volume is calculated by summing up the individual gas density measurements
at
each point and then using
the lidar distance measurement to determine the physical size of the plume as seen by
the
lidar. To calculate gas
emission (flow) rate, the wind speed and direction is measured locally with an
anemometer
and this data is used to
calculate the volumetric flow of the gas plume through the FoV.
To date, QLM has produced lidars for detecting CH4 and CO2,
and we plan to add other
gas species in the near future
such as ammonia.
QLM Analytics - transforming lidar data into actionable
information
QLM's system captures environmental and lidar point cloud data that contain a wealth of
time-based, 3-dimensional and
gas plume information. This rich dataset can be mined with the customizable analytics in
the QLM Cloud solution to
support a variety of operational objectives - from early warning and remote leak
detection, to LDAR supplementation to
emissions reporting, management and compliance for ESG or RSG initiatives. QLM's unique
lidar technology not only
uncovers individual sources of fugitive emissions on a facility, but it can also be used
to produce a highly-credible,
full-site measurement of emissions with very high time resolution for regulatory
emissions compliance purposes.
To prioritize actions to address emitters, we want to know:
- What exactly is leaking (and what is not leaking!)
- How big is it?
- When did it start/end?
- Is it a vent or a leak?
- Is it expected or unexpected?
- Is it a safety issue?
- Is it caused by routine activity?
- Is it real and not from some other site or source?
- And most important of all, is it actionable - with what urgency?
Emission sources have characteristics we can measure that define their importance:
- Emission Rate & Variation
- Duration / Persistence
- Location
- Timing Patterns
QLM's analytics transform these data to prioritized actions.
QLM's technology has been thoroughly evaluated by industry and accredited third party and
academic organizations. These
include multiple test campaigns at the Colorado State University METEC (Methane
Technology Evaluation Center ) facility,
multiple tests at the TotalEnergies TADI (Total Anomaly Detection Initiative) facility
in France, and multiple tests at
the UK National Physical Laboratory (NPL).
