Time-Series Emissions Analysis
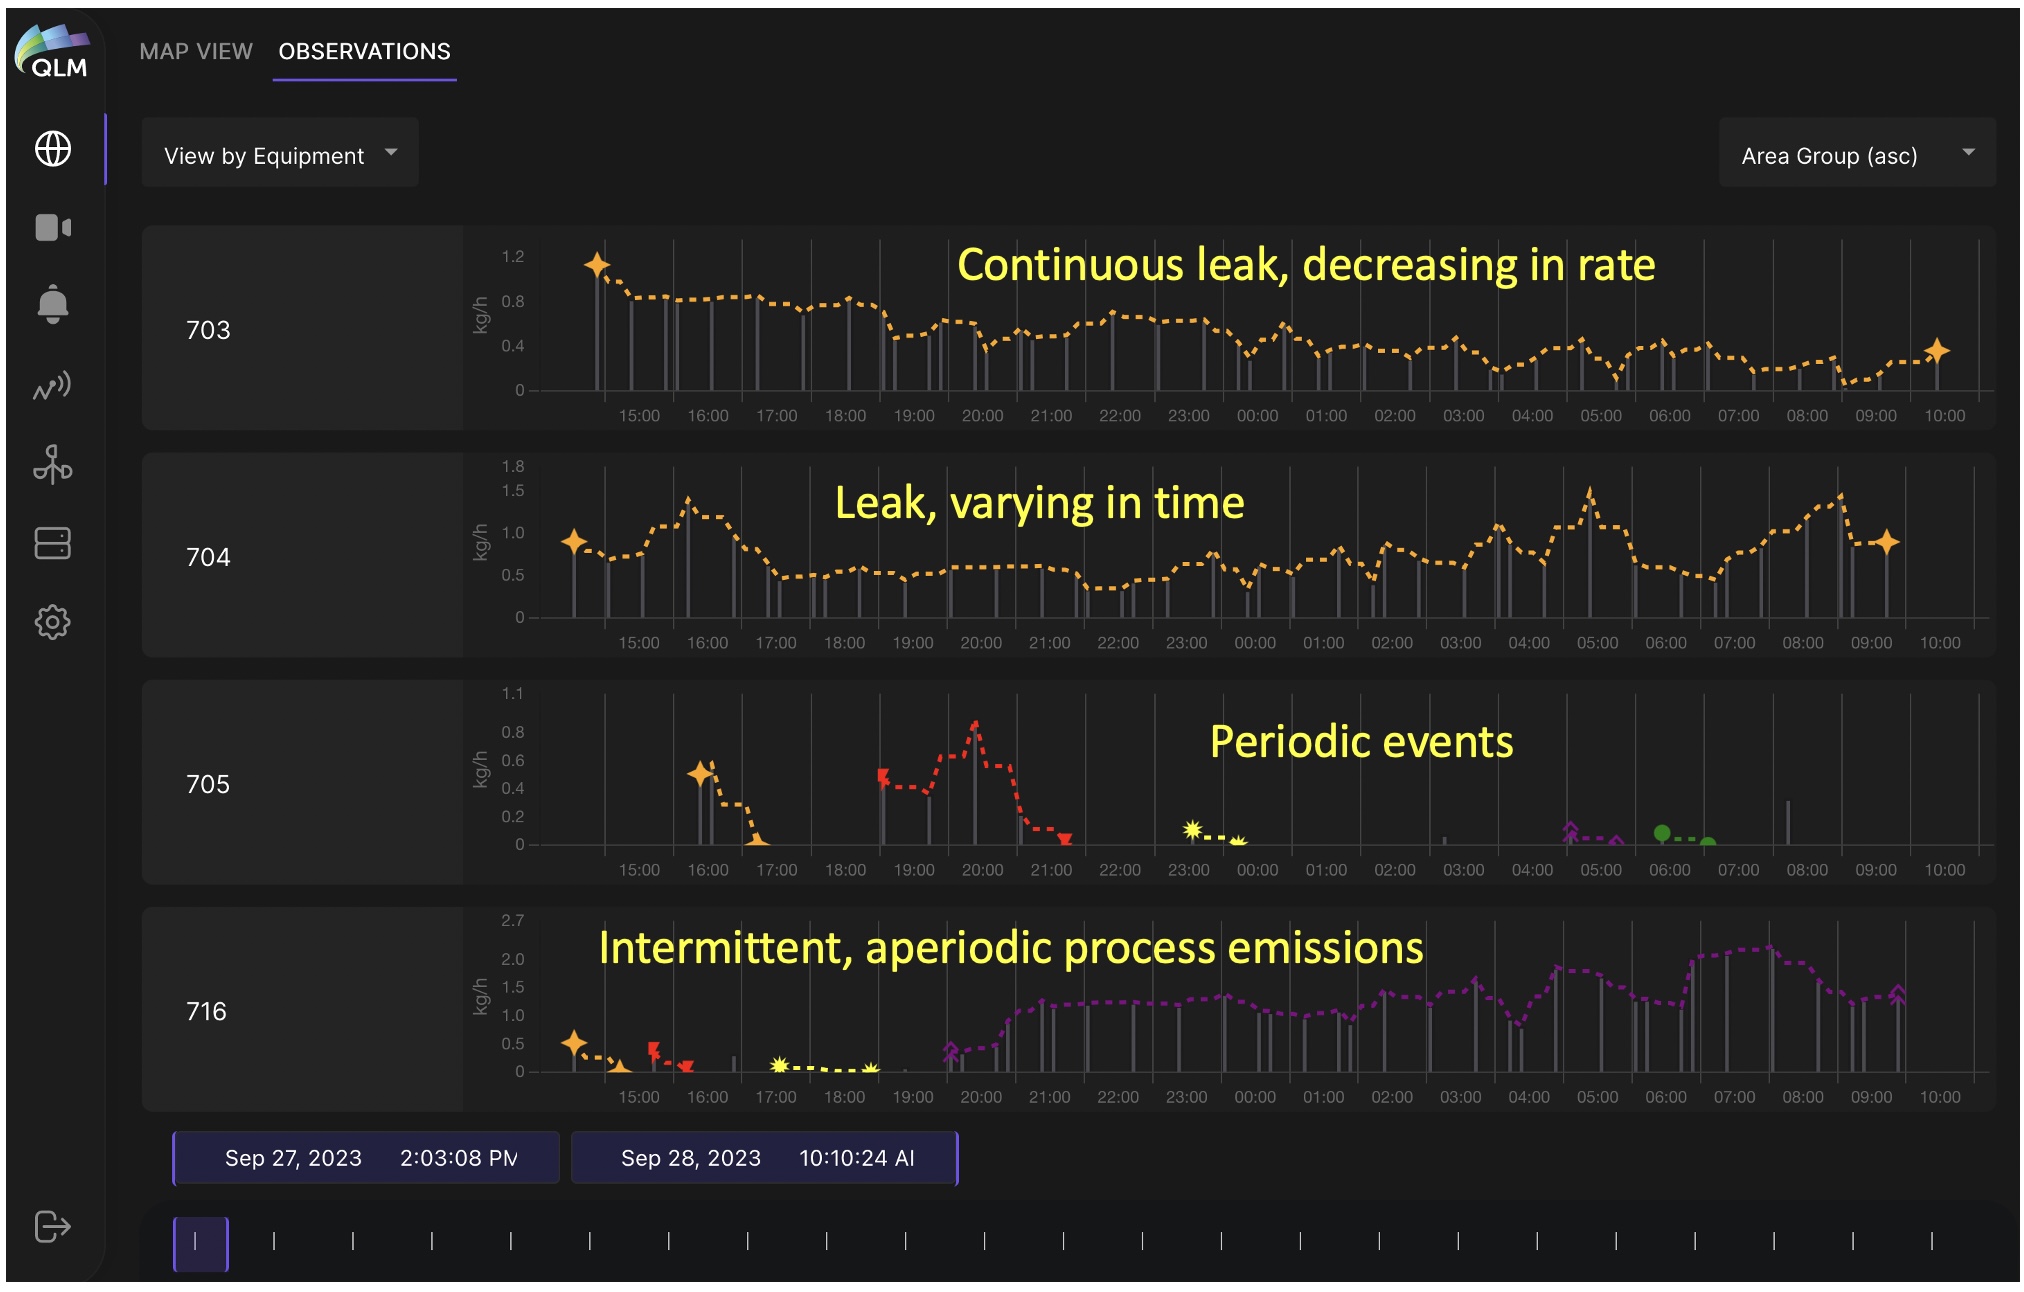
The behavior of individual emission sources in time tells us something about the underlying emission source itself. By measuring a source’s flow rate patterns, its intermittency (periodic or random?) and location on a site, it becomes straightforward to distinguish between a constant fugitive emission, a normal process emission and a one-time event. As a continuous monitor, QLM’s Quantum Gas Lidar makes it possible to gather time-series information on the emission source – and when combined with the lidar’s measured geospatial and visual information of the source – it becomes easy to determine what corrective actions to take, and in what priority order. This lets operators answer the “where, when, what and how much?” questions about their emissions. Below we see several individual emission events (isolated and color coded because of their unique spatial location) that sometimes overlap in time, and have different flow rates, durations and temporal patterns. In the QLM Cloud platform, these quantitative lidar measurements can be summed for individual pieces of equipment for OGMP Level 4 reporting or summed over the entire site for OGMP Level 5 reporting.