QLM Cloud Intro - Part 3
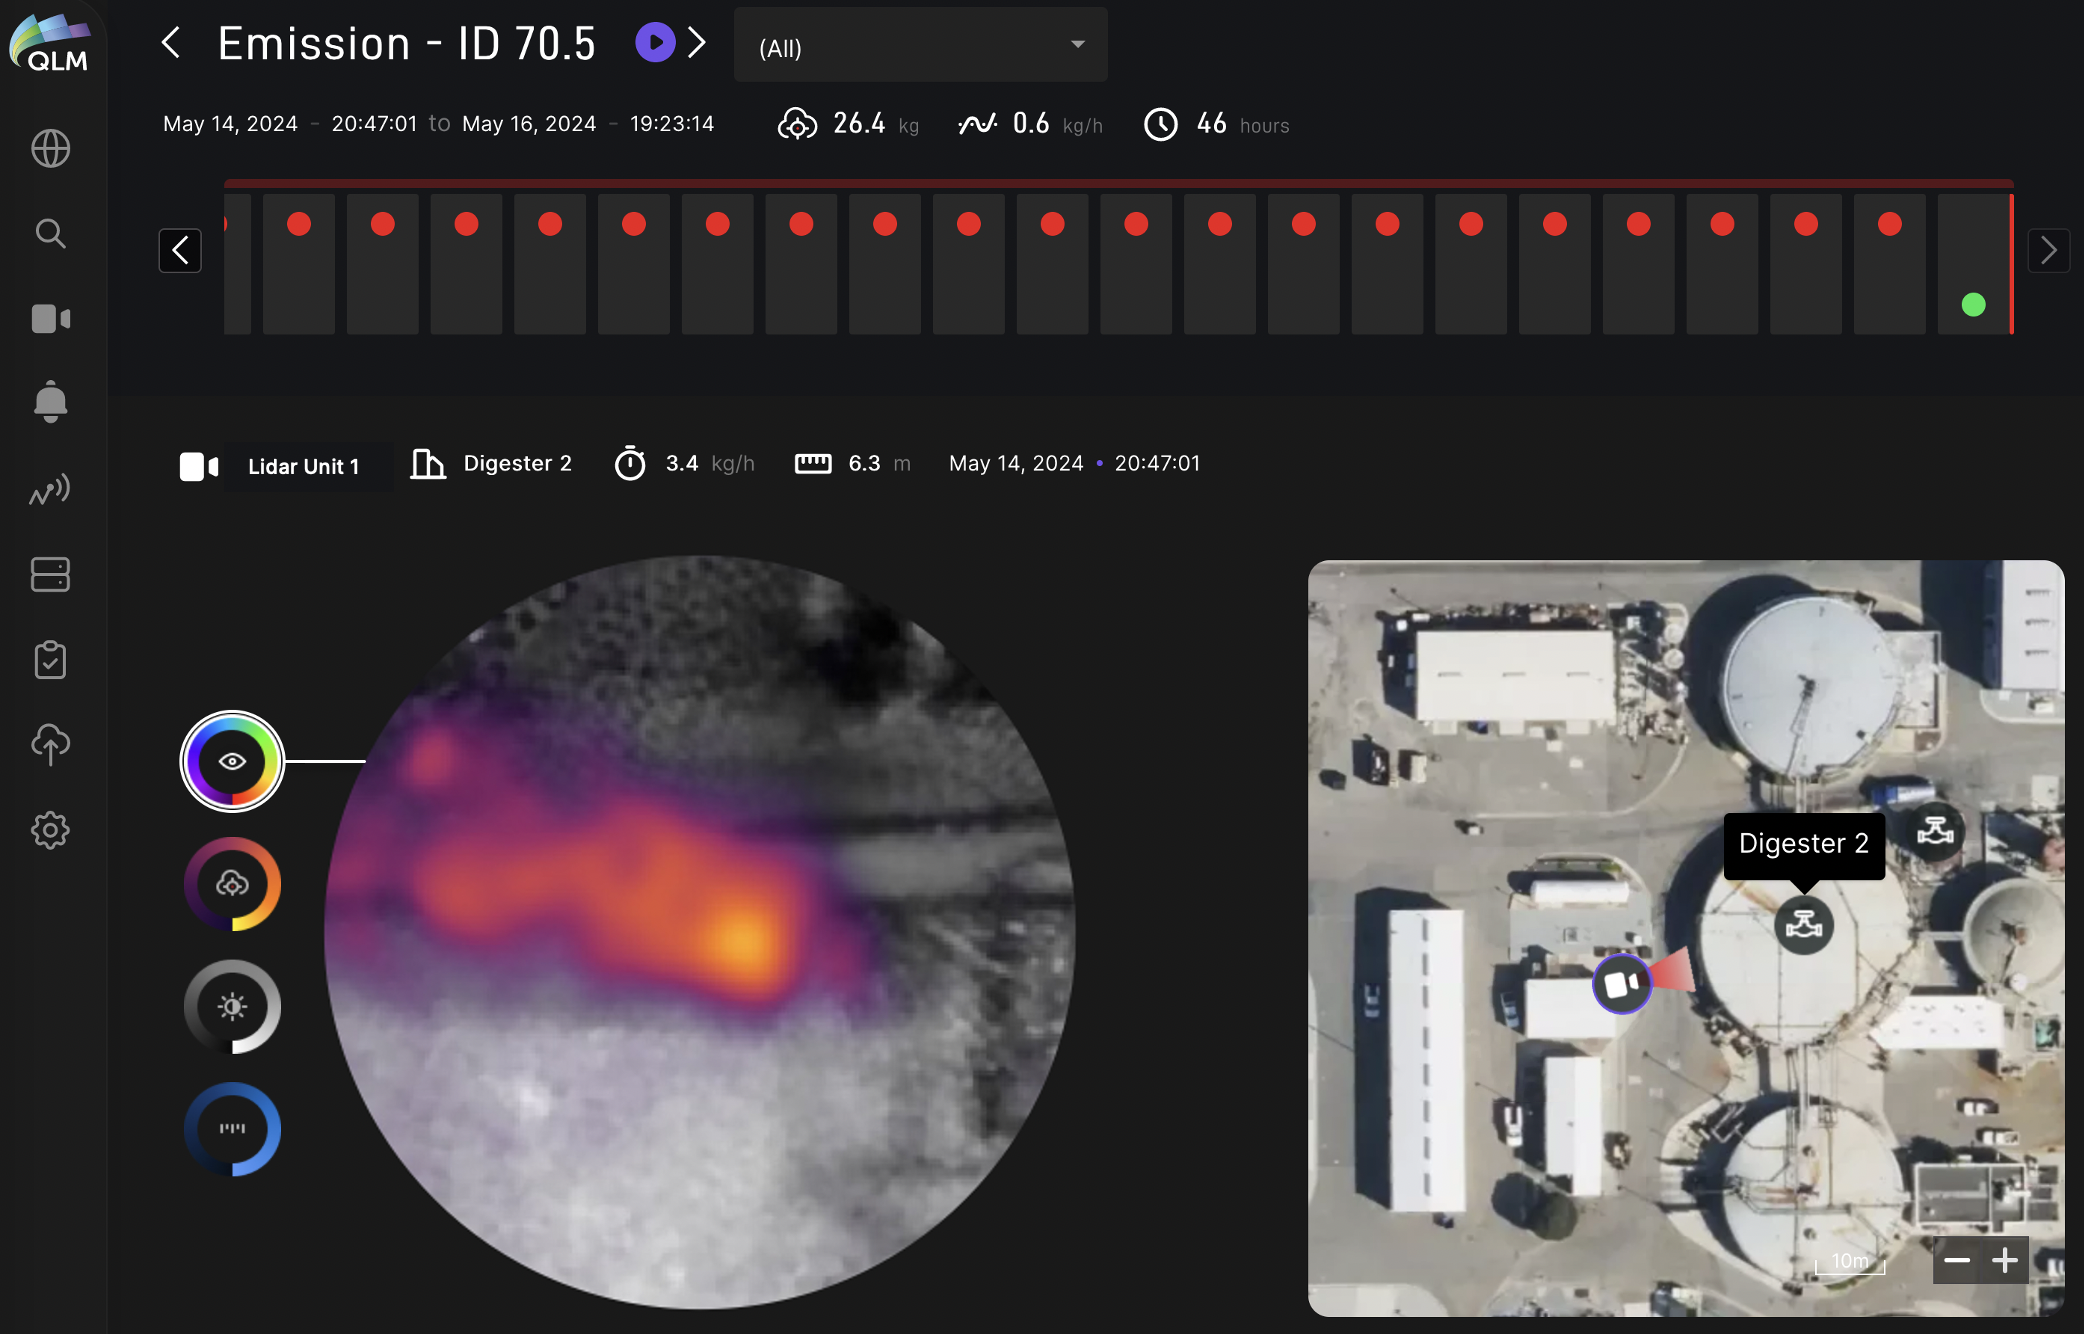
Plume of the Week! If you’ve been following our recent walk-through of the QLM Cloud workflow, here’s the latest: this screen allows detailed inspection of each individual measurement comprising an emission event which, for persistent emissions, will have many individual plume measurements. The statistics (flow rate, distance, timing, duration) for each individual plume snapshot and the average emission rate, total amount emitted and duration for the entire event are shown. An interactive map shows the lidar pointing vector relative to the equipment and emission origin. Users can select and view one of the measurements or see a sequential playback of plume images. Arrows navigate to previous or subsequent emission events and a filter can be selected to show only events on selected equipment. Various images (RGB, lidar intensity, lidar range and methane density) can be viewed for each plume measurement. Tune in again next week to see other ways we make digging into continuous plume data a breeze!