QLM Cloud Intro - Part 2
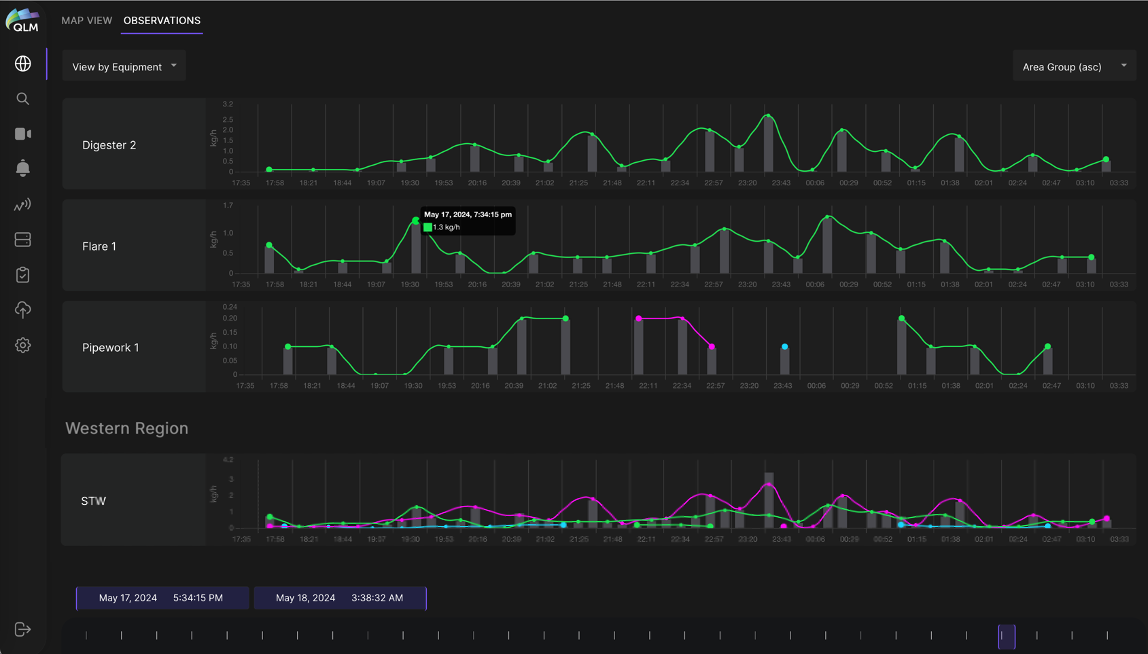
Plume of the Week! Here we show how QLM Cloud organizes and streamlines interacting with the temporal aspect of the spatiotemporal plume data produced by QLM’s Quantum Gas Lidar. Similarly to the spatial Map View shown last week, here you can look at a series of individual quantification measurements that the lidar has localized on specific pieces of equipment and plotted or group them in various ways. This view shows the time series of emission measurements (emission rate as a function of time) for a selected set of geographical elements across a selected time range. For an emission that is seen continuously on the same equipment unit, the individual measurements (dots) are connected by a lines (different colors only for clarity). Each new emission measurement is given an Emission ID (EID) number. If the emission is seen more than once, continuously, on the same equipment, each subsequent measurement retains the original EID until the emission is not seen again, at which point that EID is closed. Measurements (dots) are connected by lines if they belong to the same EID. The grey bars indicate the total emission rate at that time, summing the emission rates of all active emissions at that time for that geographical element (field, site, area or equipment). Clicking on one of the dots navigates to the Emission Data Viewer for that EID. But to learn more about THAT, you’ll have to tune in next week…