QLM Cloud Intro - Part 1
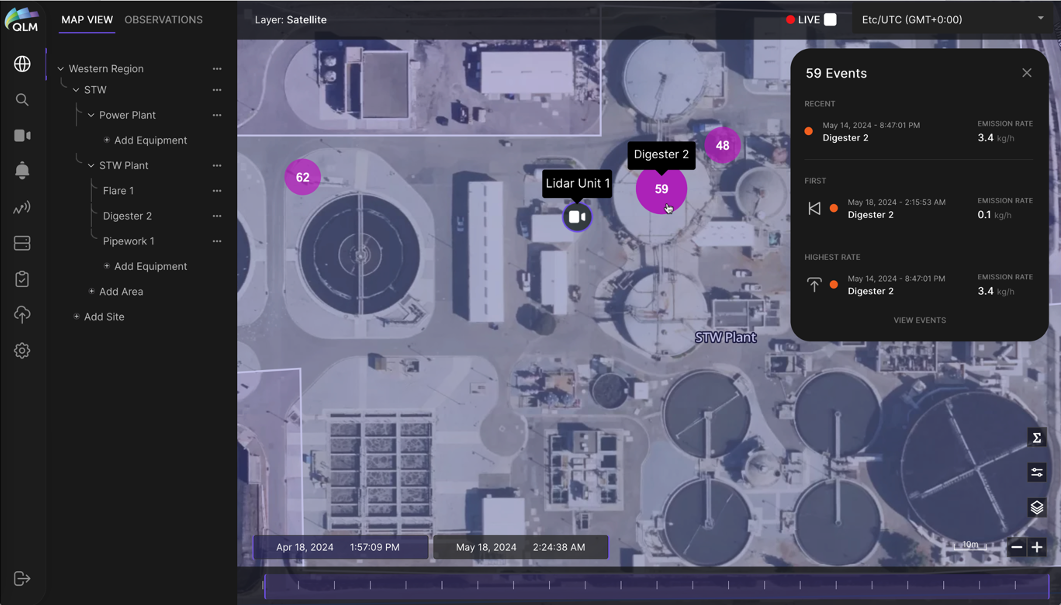
Plume of the Week! While capturing plume images every few minutes is all well and good, how do you manage all that lidar data, streaming out at 10MB/minute?! Well, first we compute at the Edge so that we only need to transport a tiny fraction of that data to the cloud. Here we show how QLM Cloud seamlessly catalogues and organizes – in time and space – the origins all those methane plumes we measure with the QLM Quantum Gas Lidar. Below is Map View showing the count of positive detections (in purple circles) across a selected date/time rage, localized to equipment or locations being monitored on a facility by the QLM lidar. Clicking on one of those circles shows a summary of emission events (the most recent, the first and the event with the highest emission rate) for that item. You can also get a quick sum of emissions over that time range for selected items. What can you do next? Stay tuned for more examples of how QLM Cloud streamlines data visualization, analysis and reporting.