QLM
Monitor & Detect
QLM Cloud lets users visualize and easily manage lidar imagery and data collected by QLM's Quantum Gas Lidar. The lidar has a range of ~200m (~650ft) so many sites can be fully and continuously monitored with just one lidar system, though monitoring may be done over multiple sites. Either way, QLM Cloud streamlines automated data collection from one or more lidar systems deployed in the infrastructure and provides optional, real-time control for on-demand, remote inspection and situational awareness of emission events.
How does it work?
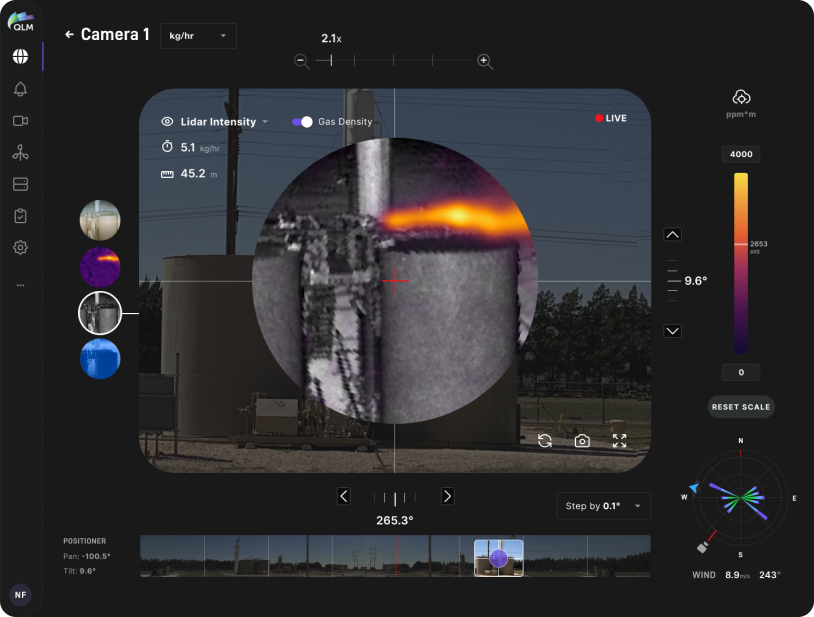
Within QLM Cloud, there is a site setup tool where operators can define which areas or pieces of equipment on a site should be monitored by the QLM lidar, in what sequence and duration, and with what level of optical zoom, defining a field of view for each pointing angle of the lidar. Once defined, the system automatically and repeatedly steps through each programmed pointing position, collecting lidar data. If an emission is detected, the system quantifies and pinpoints the emission source in 3D using the lidar data. Images of the emission plume and context imagery of the related infrastructure are recorded. The images include:
- Visible light imagery
- Lidar signal intensity (greyscale)
- Lidar range (distance) image (false color)
- Gas (i.e. methane) density image (false color, ppm*m scale)

If an operator is viewing or controlling the lidar in live view, visible imagery supplements the lidar imagery for situational awareness, and live wind information is displayed from the system's anemometer. An operator can view live results of a measurement sequence, or can take control of the lidar's pan/tilt control and conduct manual measurements. QLM Cloud provides administrative functionality for operators that allows various access and user permission levels for such functions including viewing, control and customizable detection and notification thresholds.

Locate & Map
Live and historical emission data is presented in a map view that allows users to see events, mapped by their GPS coordinates, within selectable time windows and geographic areas. The most recent event, the first event, and highest flow rate event are automatically shown for the given time period and area. The number of events is grouped depending on map zoom level, and events can be grouped by user-defined geographic hierarchies such as by site, area, equipment group, etc. Users can also see the aggregated, total emissions of a selected geographic area over a selected period of time.
Pinpoint & Quantify
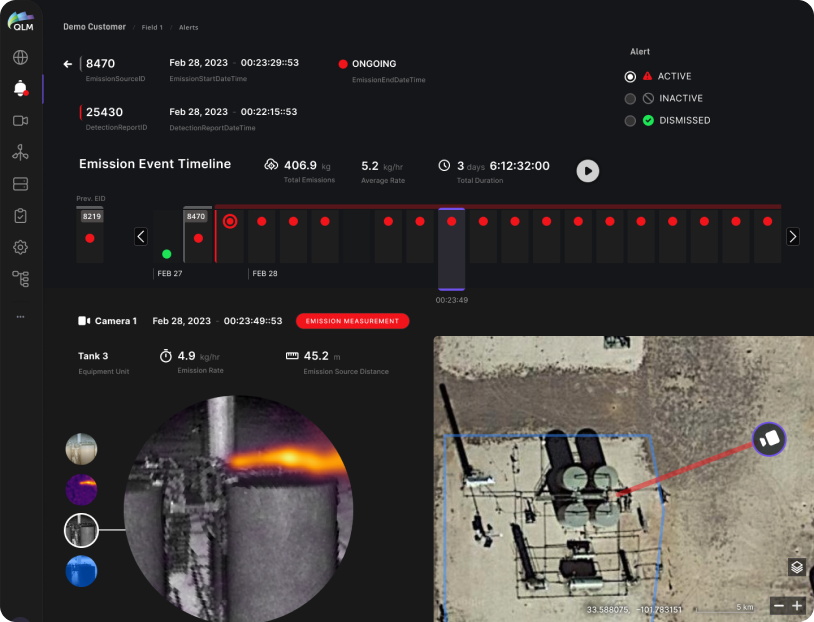
When an emission event is measured, it is assigned a unique ID number, and the event is marked as active for as long as it continues to be detected in the same location on each subsequent observation. An event viewer allows users to view gas and context imagery and map location data for each positive or null (i.e. no gas detected) observation. When an event stops, that event ID is marked as closed. If an event recurs in the same location, a new event ID is created. Emission events, durations and gas flow rates are cataloged in this way and the event viewer allows users to view granular data for each observation including imagery, emission quantification (i.e. gas flow rates, in a variety of volumetric or mass flow units). Source GPS location and measured lidar distance to the emission source, and historical wind data are also shown.
Plot & Analyze
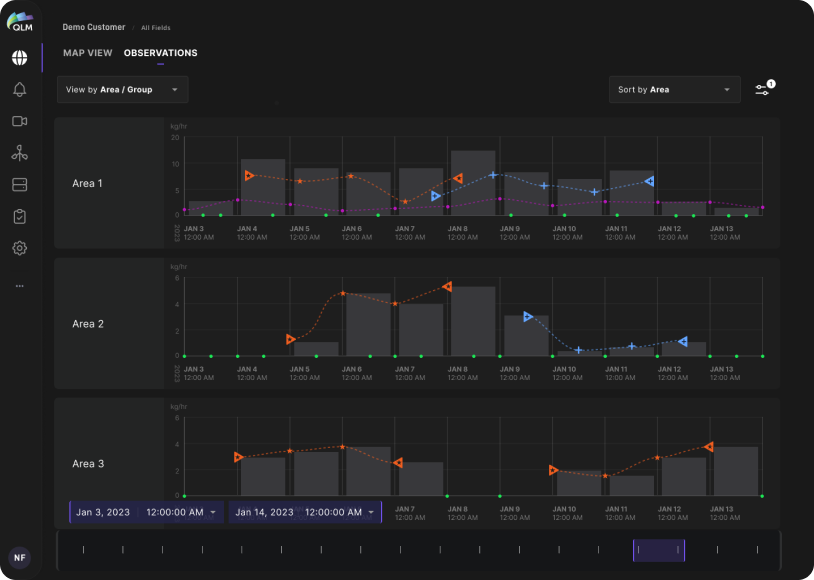
Emission events are uniquely defined by their location and start/end times, and using a time-series analysis tool, emission events (and zero-emission observations) can be plotted in time, in various spatial groupings so that patterns and trends can be analyzed visually. Aggregate emissions combining multiple emission sources are also shown so emission rate trends can be analyzed over time periods ranging from hours to years.
Alert & Notify
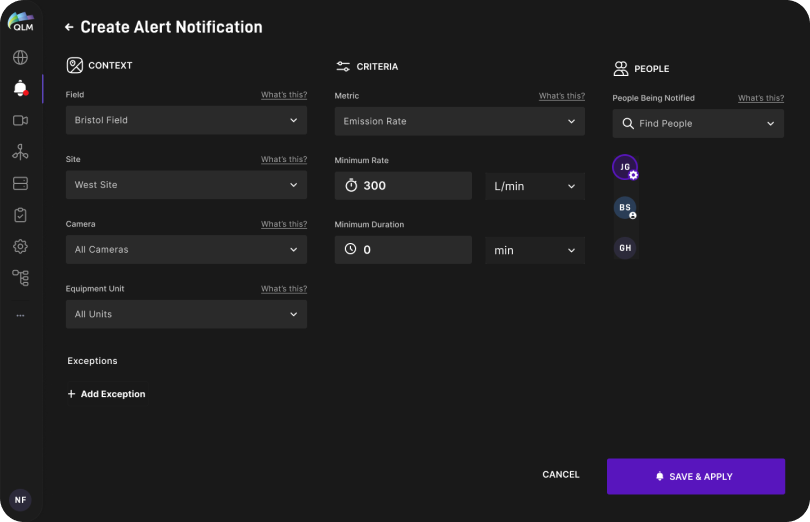
Customized emission event alerts and notifications can be configured so that certain users can be notified via email or SMS messages if emission events exceed user-specified thresholds (in emission rate and/or duration), on specific equipment, sites or areas, or as detected by specific QLM lidar units.
Using QLM Cloud's administration tools, an operator configures which users have access to define or receive alerts and notifications and which users can utilize various aspects of the reporting functionality among other administrative controls.
Report & Certify
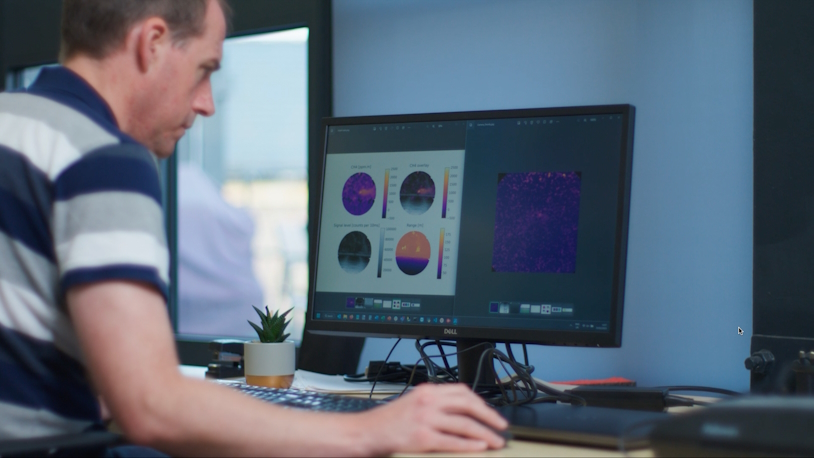
Customized report functionality allows users to run reports that output a detailed events list, a events map, gas and context imagery and other data, as well as aggregate emissions across defined geographic scales and time periods. Historical reports that detail emissions of a particular site, area or piece of equipment can also be defined. This can also include, for example, emissions statistics by equipment, time duration and site geography.
Planning & Installation
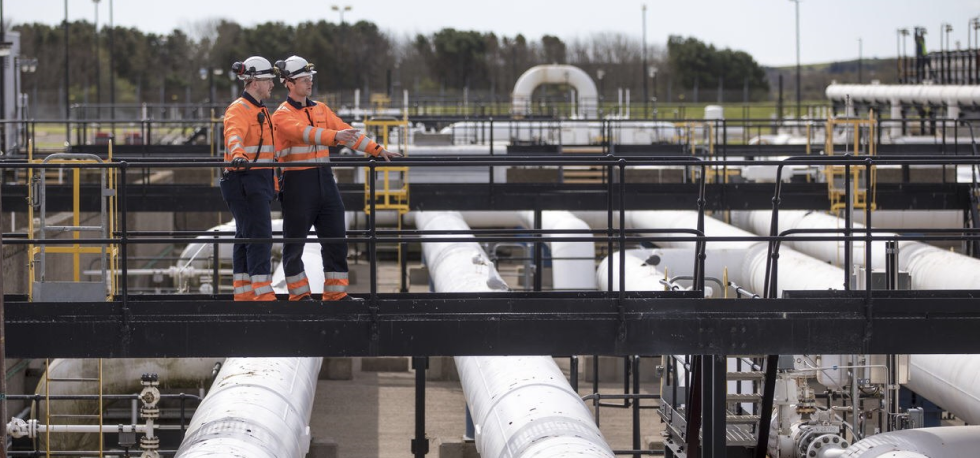
Before the QLM system is deployed, our experienced team works with your ESG, operations and engineering teams to understand the overall business, safety, operations and environmental goals of your emissions monitoring program. We look at the site and equipment layout and perform site surveys to scout the locations and vantage points for the QLM lidar units, and work out the various logistical deployment details including fixturing, power and data connections. A comprehensive deployment and measurement strategy is developed and we define areas and pieces of equipment to be monitored by the QLM lidar.
Configure & Automate
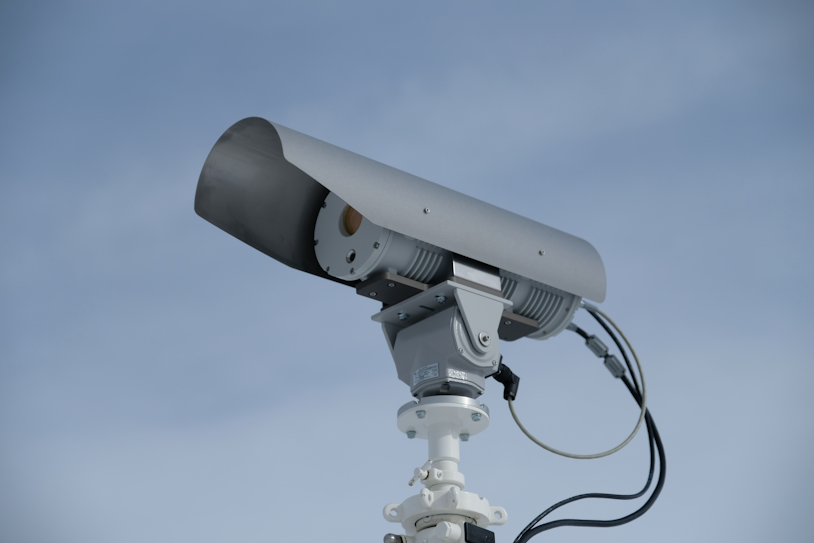
The system is installed, and during this provisioning phase, again pairing with your staff, we define the level of optical zoom used in each targeted area - this defines a field of view for each pointing angle of the lidar. We then define the measurement sequence and duration for each measurement, and once defined, the system automatically and repeatedly steps through each programmed pointing position, collecting lidar and emissions data. Data is transported to the QLM Cloud via a persistent, encrypted tunnel. During the provisioning activity, we train administration and operations staff on the use of the QLM system so that they're able to make their own adjustments in these settings in the future to customize performance.