
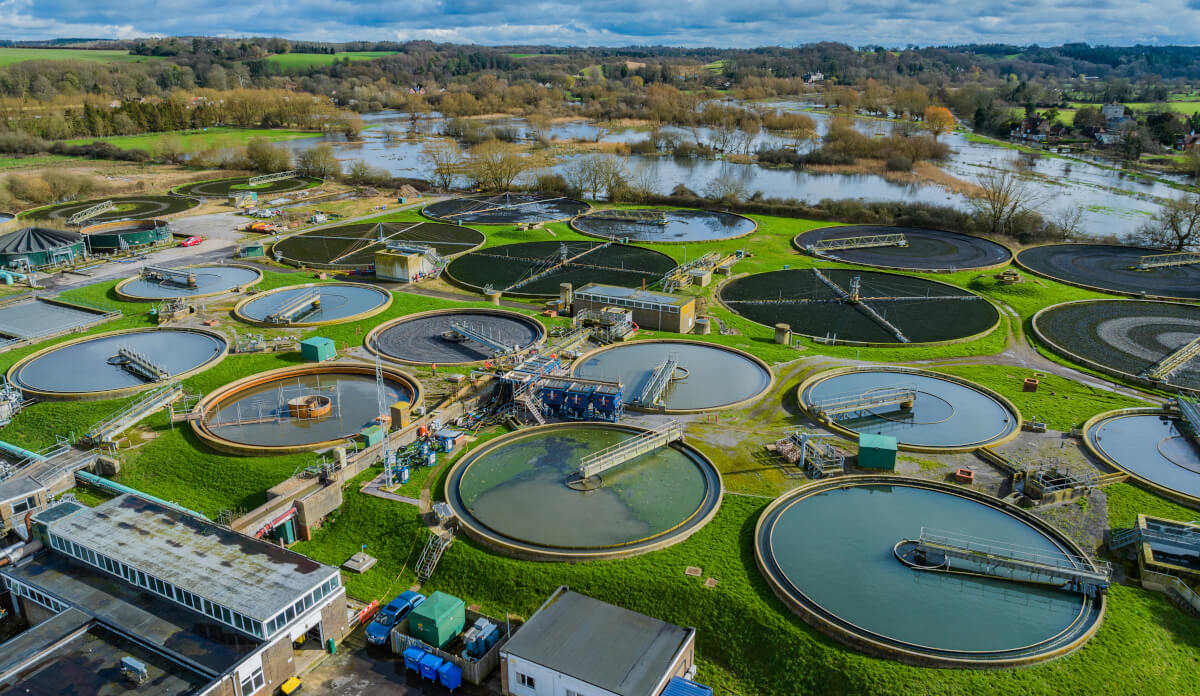
Methane Detection for Wastewater Utilities
Support OFWAT’s 2030 methane reduction and 2050 net zero targets with measurements you can prove and act on. QLM’s Quantum Gas LiDAR quantifies methane from digesters, lagoons, sludge handling and flares, delivering real, continuous data instead of modelled estimates. Each unit provides mapped coverage with a radius of up to 250 metres, equivalent to approximately 20 hectares or 49 acres, with pinpoint accuracy. This helps utilities understand, reduce and monetise emissions across their sites.
What wastewater teams must solve
UK wastewater utilities must now understand, report and reduce methane across every site to meet OFWAT’s reduction and net zero targets. Accurate, continuous visibility of emissions supports compliance, leak reduction and renewable energy recovery.
Intermittent and diffuse sources
Large, variable sites produce emissions that change over time. Snapshots miss intermittent or diffuse events across digesters, lagoons and headworks, leaving data gaps in methane reporting.
Legacy assets and seals
Floating roof digesters and ageing fittings leak at multiple points as process states shift. These persistent releases make it hard to maintain accurate, defensible emission baselines.
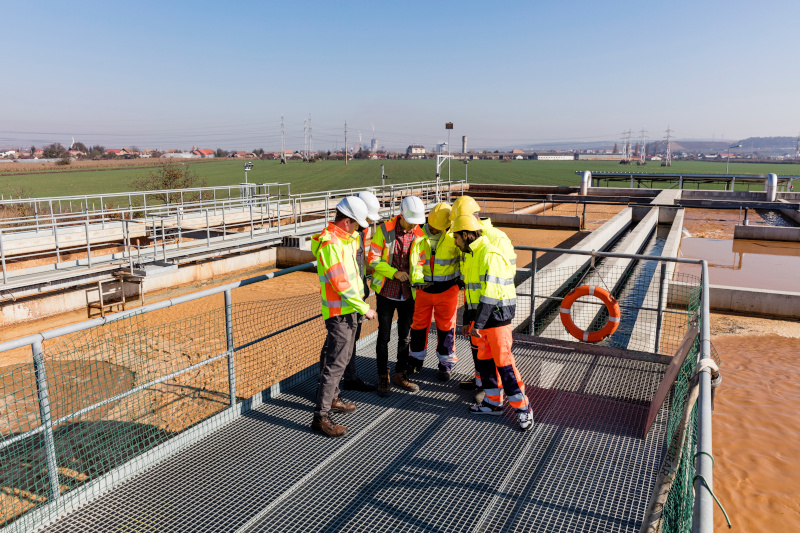
Safety and access
On-roof inspections are restricted by safety requirements and resources. Limited visibility delays detection and increases truck rolls, while lost gas represents both compliance risk and wasted energy potential.
How QLM solves it
QLM’s Quantum Gas LiDAR delivers continuous, high-accuracy methane detection across wastewater facilities. This enables utilities to capture real, continuous data rather than modelled estimates, providing the insight needed for confident decision-making and continuous improvement.
Continuous monitoring
Fixed Quantum Gas LiDAR provides real-time coverage for digester arrays, sludge tanks and headworks with source location and rate estimates.
Periodic monitoring
Deploy on a planned cadence to verify baselines, investigate anomalies and document fixes without a permanent install.
Site-level surveys
Map difficult areas such as sludge lagoons and open tanks to capture diffuse plumes and prioritise remediation.
- Quantified methane detection with precise rate estimates
- Continuous or right-sized intermittent site coverage
- Accurate measurement for defensible reporting and carbon accounting
- Real operational data that replaces assumptions and drives better outcomes
How the system works on your sites
QLM combines advanced Quantum Gas LiDAR hardware with QLM Cloud analytics to deliver complete, continuous visibility of methane emissions across wastewater facilities. The system provides real data with pinpoint accuracy, replacing assumptions and supporting confident, evidence-based decisions.
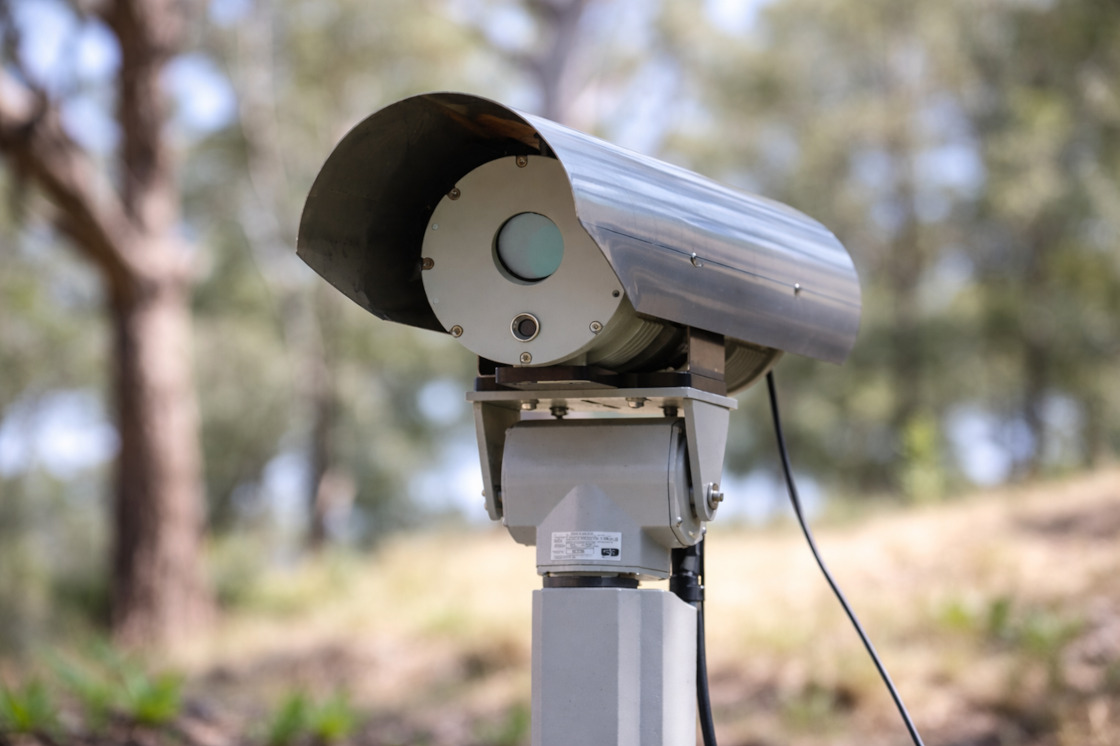
Quantum Gas LiDAR
Scans assets and renders methane plumes in 3D for real-time, 24/7 visibility. Elevated placement creates safe stand-off coverage of digesters and surrounding pipework. The system localises sources and estimates emission rates so teams can rank issues by impact and prioritise repairs where they matter most.
QLM Cloud
Detections flow to QLM Cloud for analysis, alerts, wind and context capture, and audit-ready reporting. Data is stored with timestamps, rate estimates and operator notes to maintain full provenance from detection to export. Insights integrate directly into carbon accounting, compliance reports and renewable energy planning.
QLM Quantum Gas LiDAR camera
Built for wastewater operations
Each Quantum Gas LiDAR unit maps an area with a radius of up to 250 metres, covering around 20 hectares with pinpoint accuracy. The camera visualises methane plumes in 3D and estimates emission rates across typical WWTP layouts. It supports continuous coverage at priority units and intermittent deployments to verify baselines, document fixes and accelerate improvement projects.
- 3D plume visualisation with source localisation
- Supports continuous and intermittent strategies
- Integrates with QLM Cloud for timelines and exports
- Provides verifiable data for methane reporting and decision-making
Where it delivers value
QLM’s system delivers measurable results across key wastewater processes, helping utilities verify repairs, reduce emissions, and feed accurate data into reporting and improvement projects.
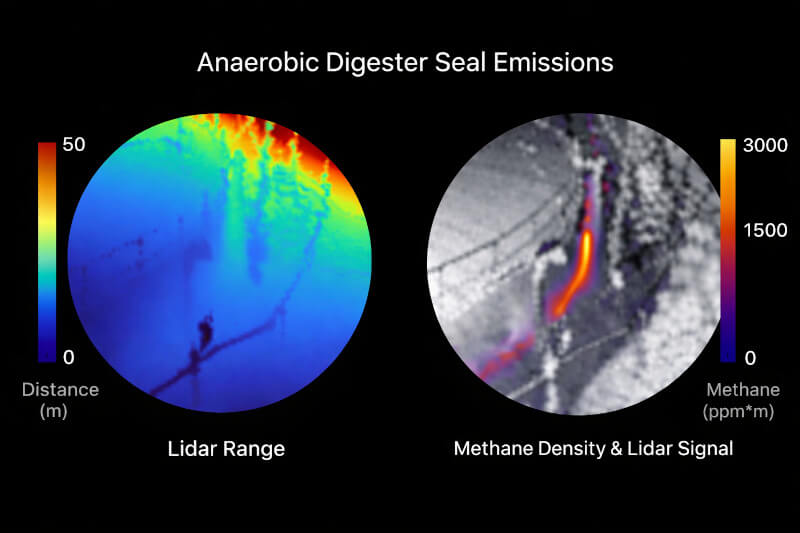
Anaerobic digesters
Identify persistent roof leaks and quantify reductions after maintenance or roof upgrades to show verified improvements over time.
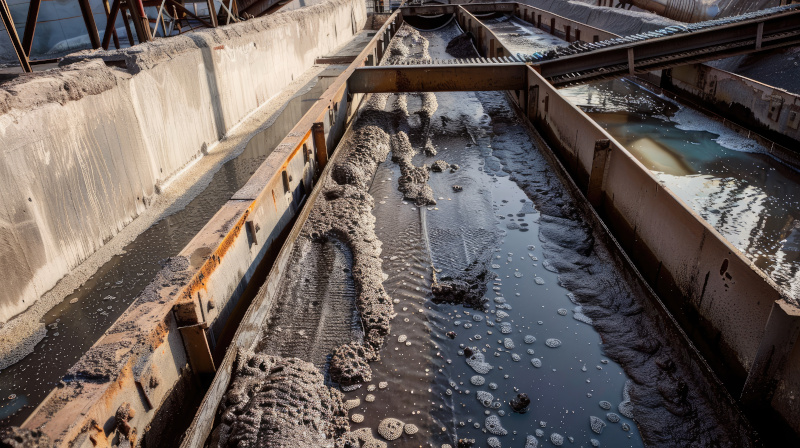
Sludge lagoons and tanks
Detect wide, low-concentration plumes and track variation with process changes to prioritise emission reduction and methane recovery efforts.
Headworks and covers
Monitor fittings and seals that fail intermittently and use rate data to guide targeted maintenance.
Pumps, flare and vent
Confirm combustion and vent performance with quantified records that support carbon accounting and audit evidence.
Turn methane reporting into measurable results
Severn Trent Water deployed QLM's Quantum Gas LiDAR across multiple wastewater treatment works in a comprehensive methane detection programme spanning 2023-2024. The deployment discovered 37 previously unknown methane emission sources, quantified variable biogas leakage across digesters and lagoons, and delivered field-verified programme-level results showing the cumulative environmental and financial impact of systematic methane monitoring.
Early Detection Programme: 6-Month Deployment
Detection lag reduced by 6 months
Programme scope: Continuous monitoring across multiple treatment works identified 37 previously unknown methane emission sources, including faulty compressor valves, digester seal leaks, and biogas infrastructure inefficiencies. Average leak rate: 0.07 g/s per source.
Time advantage vs conventional LDAR: Early detection enabled remediation 6 months ahead of scheduled walkover inspections. Cumulative emissions avoided: 2,220 tonnes CO₂e. Remediation costs averaged low (under £5k per fix).
Digester Fleet Baseline: Annual Quantification
120 tonnes CH₄/year total emissions
Programme finding: Floating-roof digesters at medium to large AD treatment works averaged 10 tonnes methane/year per digester. Measured emissions were 'significantly lower' than modelled assumptions in the carbon accounting workbook, providing confidence for accurate Scope 1 reporting.
Fleet-wide financial impact: 12 digesters = 60,000 tonnes CO₂e/year. Annual recovery value: £900k carbon + £80k electricity with feed-in tariff + £150k gas-to-grid GGSS. Data now informs £60M+ remediation investment decisions across the fleet.
Lagoon Net Zero Roadmap: 12-Month Continuous Study
30,000 tonnes CO₂e/year total emissions
Deployment insight: Uncovered sludge lagoons (100x50m) exhibited highly variable methane emissions (10-40 kg/hr) requiring year-round continuous monitoring for accurate quantification. Seasonal variation and loading rates significantly impacted total emissions. Satellite remote sensing corroborated ground-based LiDAR measurements at larger multi-lagoon sites.
Net Zero investment case: 5 lagoons = £3.3-13.5M annual carbon value + £500k-3M gas valorisation potential. 12-month measurement data enabled defensible business cases for complex remediation (lagoon covering, alternative AD plant design) and credible Net Zero target-setting.
Measurement-based reporting turns LDAR into a closed loop; find, verify, fix, prove. QLM's system replaces estimation with quantifiable evidence, helping utilities measure, verify and prove methane reductions.
- Time-stamped plumes and quantified rates make reviews faster
- Continuous signals and well-timed returns capture intermittent releases
- Site-level measurements roll up cleanly to utility-level disclosures
- Events link to process states so teams fix what matters
Case Studies
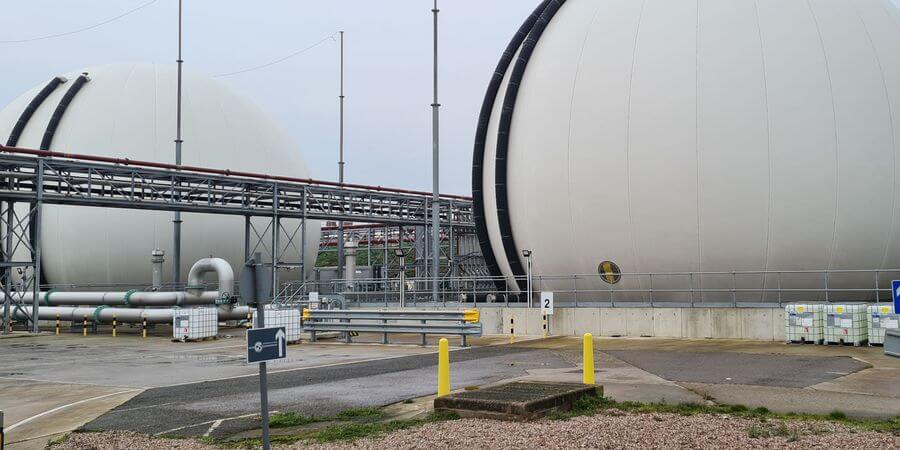
Severn Trent Water: Minworth Biogas Facility
Monitoring biogas facilities at the UK's largest sewage treatment works
Severn Trent deployed QLM's Quantum Gas Lidar at Minworth, their largest sewage treatment works serving 2.3 million people. The system monitored a sixteen-tank anaerobic digester array and gas-to-grid plant producing 30% of their renewable energy. The trial successfully identified and quantified previously unknown fugitive methane emissions from digester tank walls, pipework joints and decarbonisation engines, providing Severn Trent with precise leak locations and flow rates to prioritise repairs by size, safety and maintenance impact.
What teams see in QLM Cloud
QLM Cloud provides utilities with a single platform to visualise, validate, and report methane emissions with full transparency. Continuous data replaces assumptions, providing defensible evidence for audits and carbon disclosures.
Real-time views
Detections with source localisation and rate estimates, showing verified activity across digesters, tanks and pipework.
Event timelines
Link detections to process states, track remediation progress and maintain a verifiable chain of events.
Multi-site dashboards
Monitor assets across regions, standardise reports and export clean, audit-ready evidence for compliance teams.
Questions from wastewater operators
Utilities often ask how continuous monitoring fits within existing operations, compliance goals and budgets. These answers reflect what QLM has delivered across real wastewater facilities.
Is continuous monitoring suitable for WWTPs?
Yes. Use permanent coverage on high-priority areas such as digester arrays and sludge handling, then add intermittent deployments and surveys on a planned cadence to cover wider assets. This blended approach supports OFWAT methane-reduction and net-zero targets without excessive infrastructure.
How does this help with utility reporting?
Measurement-based reporting provides defensible evidence for internal and external stakeholders. QLM Cloud maintains provenance from detection to export, with timestamps, rate estimates, and operator notes, giving utilities verified data for carbon accounting, ESG disclosures, and audit confidence.
Do we need permanent cameras everywhere?
No. Most utilities combine continuous coverage on critical units with intermittent deployments and site-level surveys to balance coverage, cost and return. This strategy reduces truck rolls, strengthens methane inventories and identifies opportunities to recover gas as renewable energy.
Talk to a wastewater specialist.
For procurement and compliance teams
Use this detail to plan a pilot, compare LDAR costs and map measurement to your reporting and methane-reduction obligations under OFWAT’s 2030 and 2050 goals.
Business case and ROI
Estimate recovered gas value from emission rate, gas price and time. Continuous measurement identifies long-term savings from leak prevention, reduced truck rolls and process optimisation, while supporting methane recovery as a renewable energy source.
Compliance mapping
Align outputs to utility ESG disclosures, carbon accounting frameworks and internal audit trails. Exportable evidence packages show full provenance from sensor to report and help validate methane emission factors for future reporting.
Deployment options
Start with a pilot at one WWTP. Scale to regional standards and then to enterprise. Choose purchase, lease or managed monitoring with analytics and alerting for simple adoption across operations.
Integration and data
Connect alerts to work management, export to common formats and integrate with data historian or SCADA systems. Operators retain ownership of measurement data, enabling transparent, enterprise-wide insight.